Chegg Return on Investment Calculator
Giving students insight to the financial impact of their educational decisions by visualizing and simplifying a complex dataset.
Client
- Chegg Return on Investment Calculator
Services
-
- Discovery Sprint
Timeline
- 8 weeks
Technology
-
- React
- HTML
- SCSS
Chegg is an organization whose focus is on helping students succeed, and it’s no secret that student loan debt is crippling students post-graduation. The trouble is that correcting a student’s financial situation after the fact is nearly impossible. Chegg is hoping to step into the conversation early, before a mountain of debt is accrued. With an enormous amount of data at their fingertips, Chegg is positioned and eager to help students realize the longterm financial impact their decisions can have.
Problem
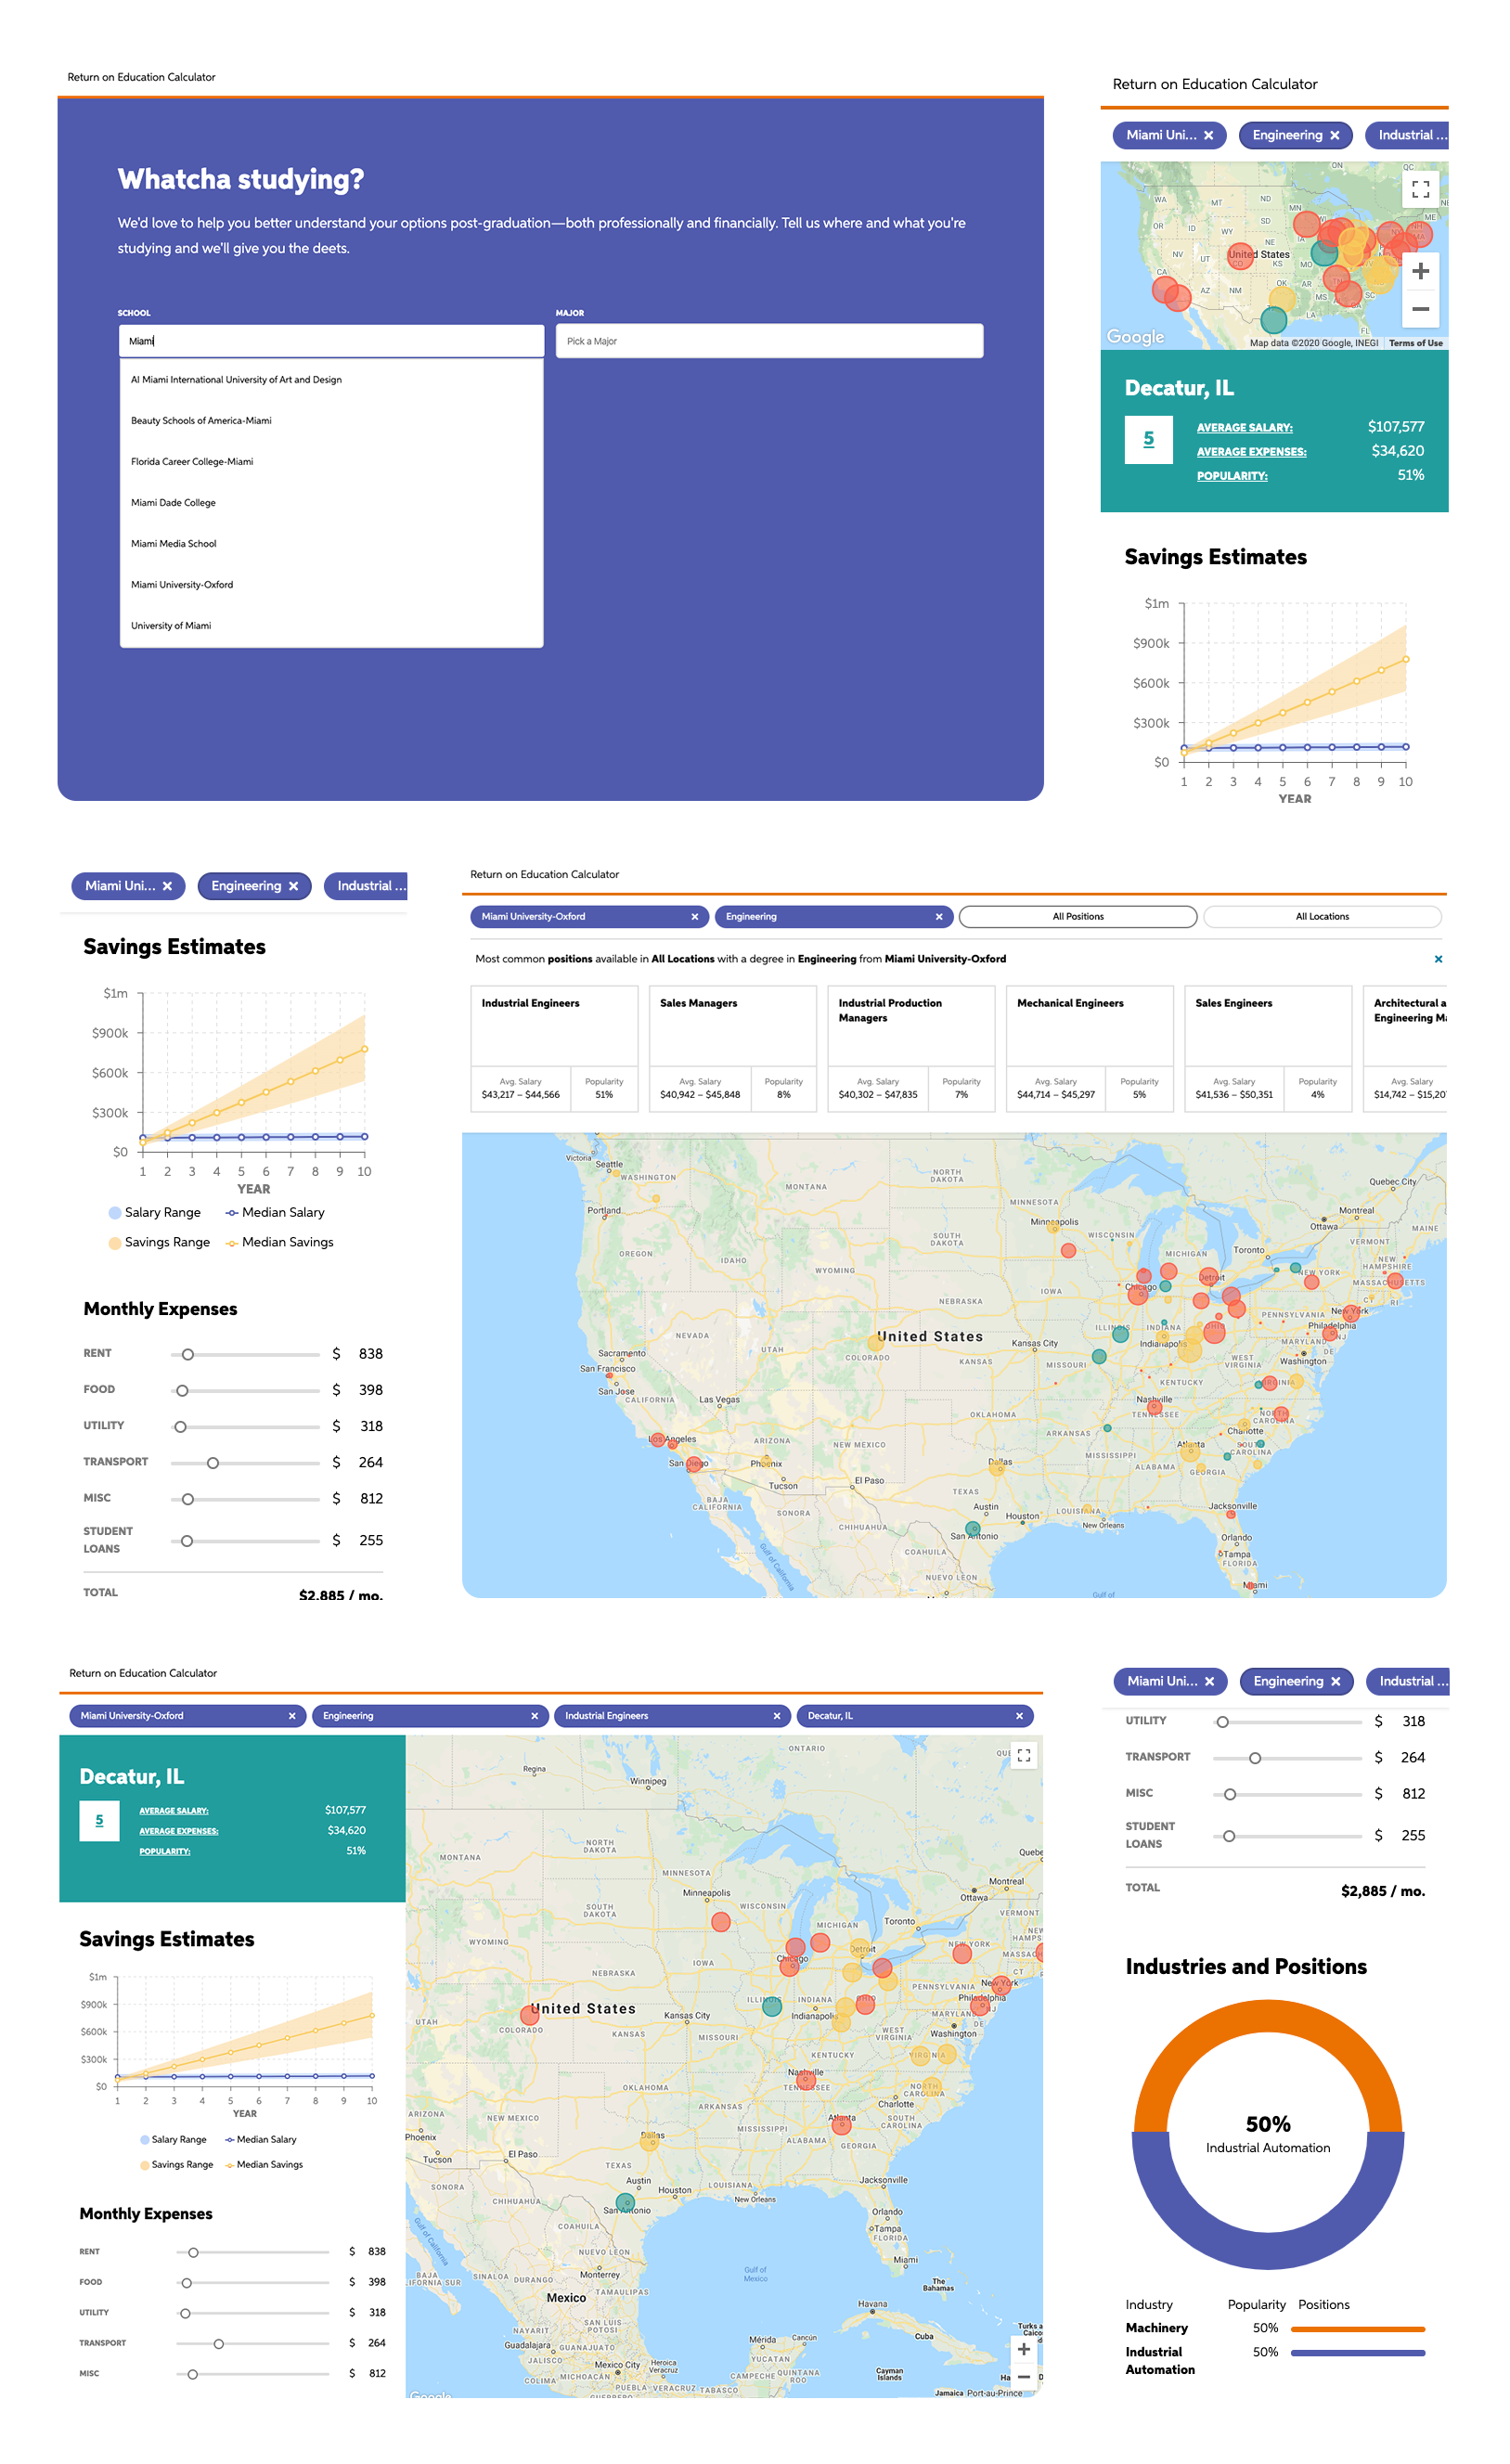
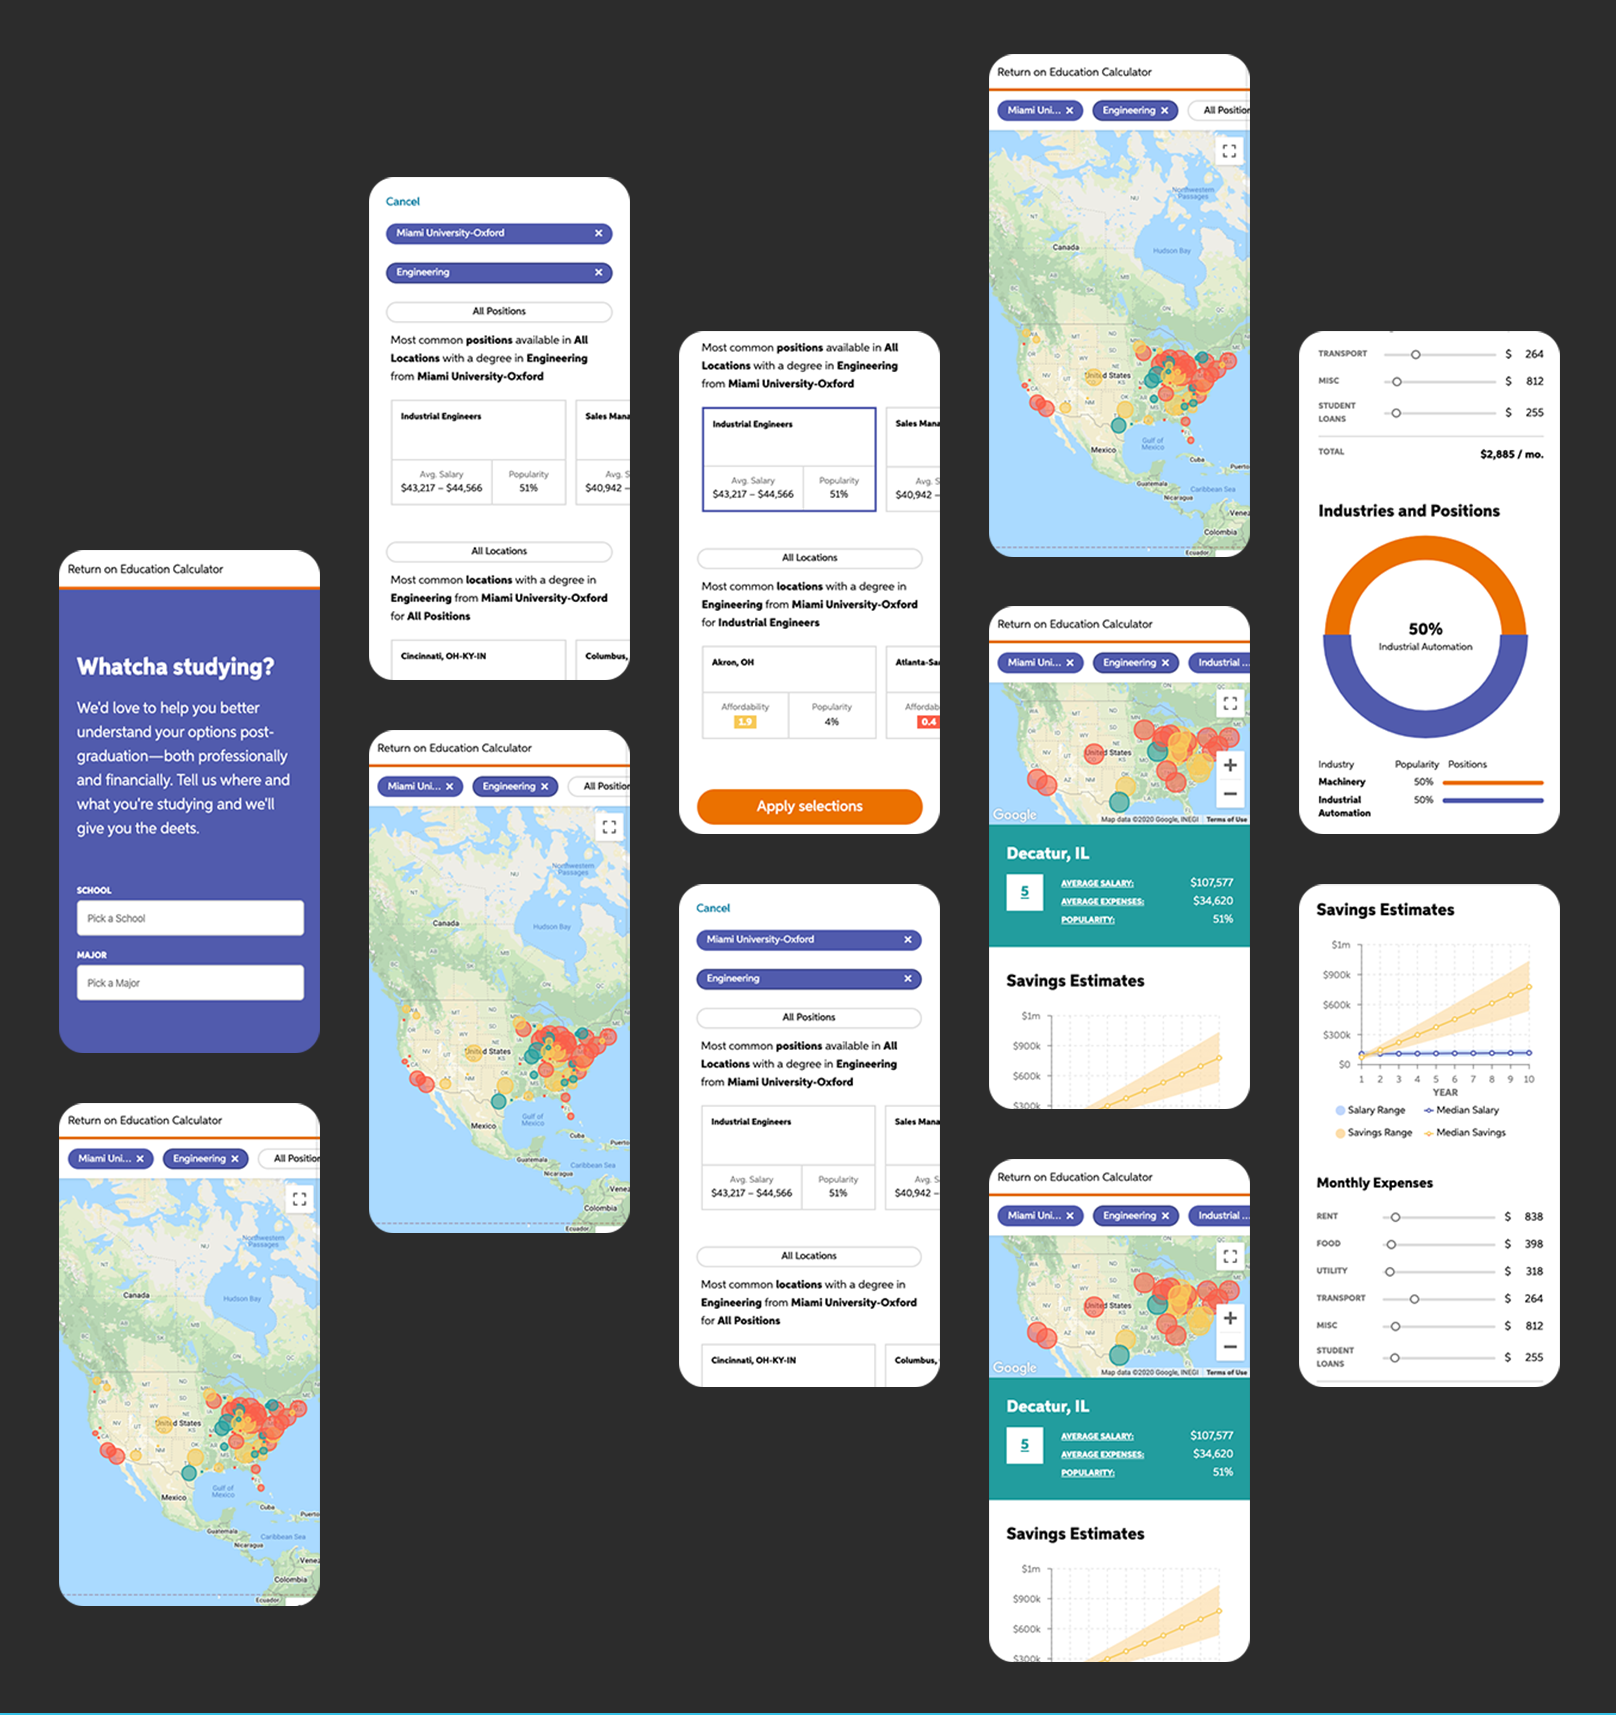
We were asked to help students make smart financial decisions around which school they will attend, which degree they will pursue, and in which city they will reside post-graduation. The student loan crisis is present and only increasing in severity. Chegg is hoping to help solve the problem by preventing it from occurring in the first place. They want to help students see both their earnings and savings potential based on their school, degree, and career decisions combined with their residing location post-graduation, and they have the data to do just that. The challenge? Data is dense. And, while valuable, the reality is that no one will use it unless it is approachable and easy to understand. After putting together a handful of solutions and conducting user testing around them, this reality became even more apparent. If the goal of the data isn’t clear and the experience of getting to that goal isn’t intuitive, the majority of users won’t engage. They found themselves in a pickle—a wealth of impactful, valuable information and no one to use it. Chegg needed a partner with designers in order to get it right. With design as an integral part of the Launch Scout process, we hit the ground running—or sprinting rather (with a Design Sprint, get it?!).
Solution
To get started, a pair of designers took a deep dive into the problem space. We familiarized ourselves with the available data, researched influences in the school-major decision making process, then compared the two. We realized that while Chegg has a wealth of information available around this topic, not all of the data points were strong influencers and began to distract from what we were trying to accomplish. We wanted to make sure that it was clear to the user what they were looking at. So, we worked with Chegg’s data scientists to strip the data down to only the most relevant pieces and began working through different solutions that allowed users to interact with the data. Drawing inspiration from unexpected places, we looked for ways to allow the user to “play” with the data and discover new things. The goal was to give the user freedom to explore, but not so much freedom that they get lost in the maze. Once we landed on the direction we wanted to head, we began to bring it to life. The process of working with Chegg through the development process was much different than our “typical” product development project. Chegg has their own development team and they have a very robust system in place to support their existing products. With their internal capacity and familiarity with their infrastructure, it didn’t make sense for us to build out the back end as it would cost more time and money to get us access and acclimated to their existing processes and codebase. Thus, we adapted and integrated with their team—we designed and built the front end while they developed API endpoints, deployment, and managed the application’s infrastructure. We also worked closely with their Project Manager, VP of Engineering, and Data Scientists. From executives to the domain expert, Launch Scout worked with each stakeholder to keep the vision clear and the project on task. Ultimately, we ended up with a product that allows users to see how their school and degree decisions can impact their earnings and savings potential across a map. The solution allows users to explore their options within a set of parameters and to realize the long term financial impacts of the decisions they are making today—something that has been hard to illustrate until this point. The next step for Chegg’s new tool? Test, test, and more testing. And then refinement. Realizing the stakes at hand, Chegg wants to be sure that we get this right. And the only way to do that is to put it in users’ hands, listen to what they have to say, and pivot accordingly.